Technical Analysis Guide for Beginners: How to Read Charts and Build a Strategy

You have been staring at a stock or forex chart for twenty minutes, and it looks like an EKG readout from a nervous patient. Green candles, red candles, squiggly lines, acronyms you have never seen before. Where do you even start?
Right here. Technical analysis is a method of studying past price and volume data to make better trading decisions. Instead of digging into a company's earnings reports or balance sheets, you examine charts, trends, and indicators to estimate where prices might head next.
This technical analysis guide for beginners walks you through the core concepts, the tools traders actually rely on, and a practical framework you can start applying whether you trade stocks, forex, or commodities.
What Is Technical Analysis and Why Does It Matter?
Technical analysis is the study of price data, trends, momentum, and market behavior to help investors make decisions about buying, selling, or managing risk. It does not ask "is this a good company?"
It asks a different question entirely: what is the crowd doing right now, and what has price done the last few times it reached this level?
Think of it like studying weather patterns. You cannot guarantee tomorrow's forecast, but decades of historical data help you dress appropriately. Technical analysis works the same way with price. It gives you probabilities, not certainties.
Why does that matter? Because it replaces gut feeling with structure. Instead of buying a stock because someone on social media called it a "moon shot," you look at the data and make your own call.
Technical Analysis vs. Fundamental Analysis
| Feature | Technical Analysis | Fundamental Analysis |
|---|---|---|
| Core data | Price and volume charts | Financial statements, economic reports |
| Key tools | Candlestick charts, MA, RSI, MACD, Bollinger Bands | P/E ratio, ROE, earnings reports |
| Time horizon | Short to medium term (minutes to weeks) | Medium to long term (months to years) |
| Primary question | Where is price heading? | What is the asset worth? |
They are not mutually exclusive. From my experience reviewing brokers and their educational resources, the traders who perform most consistently tend to use fundamental analysis to decide what to buy and technical analysis to decide when to buy it.
The Core Assumptions Behind Technical Analysis
Every indicator and chart pattern you will encounter rests on a few foundational beliefs.
Assumption 1: Price reflects everything. All available information about an asset is already baked into its price. News, earnings surprises, insider sentiment: by the time you see it on your chart, the market has already digested it.
Assumption 2: History tends to repeat itself. Market participants tend to react to similar situations in recognizable ways. Fear and greed produce the same behavioral footprints, and those footprints become the patterns you study.
Assumption 3: Crowd behavior creates structure. When enough traders watch the same levels and use the same tools, their collective actions create predictable patterns in price movement.
These are beliefs, not proven scientific laws. Technical analysis is probabilistic. It tilts the odds. It does not guarantee outcomes.
How to Read a Stock or Forex Chart
Learning how to read stock charts and patterns starts with three building blocks: candlesticks, support and resistance, and volume.
What Does a Candlestick Chart Show You?
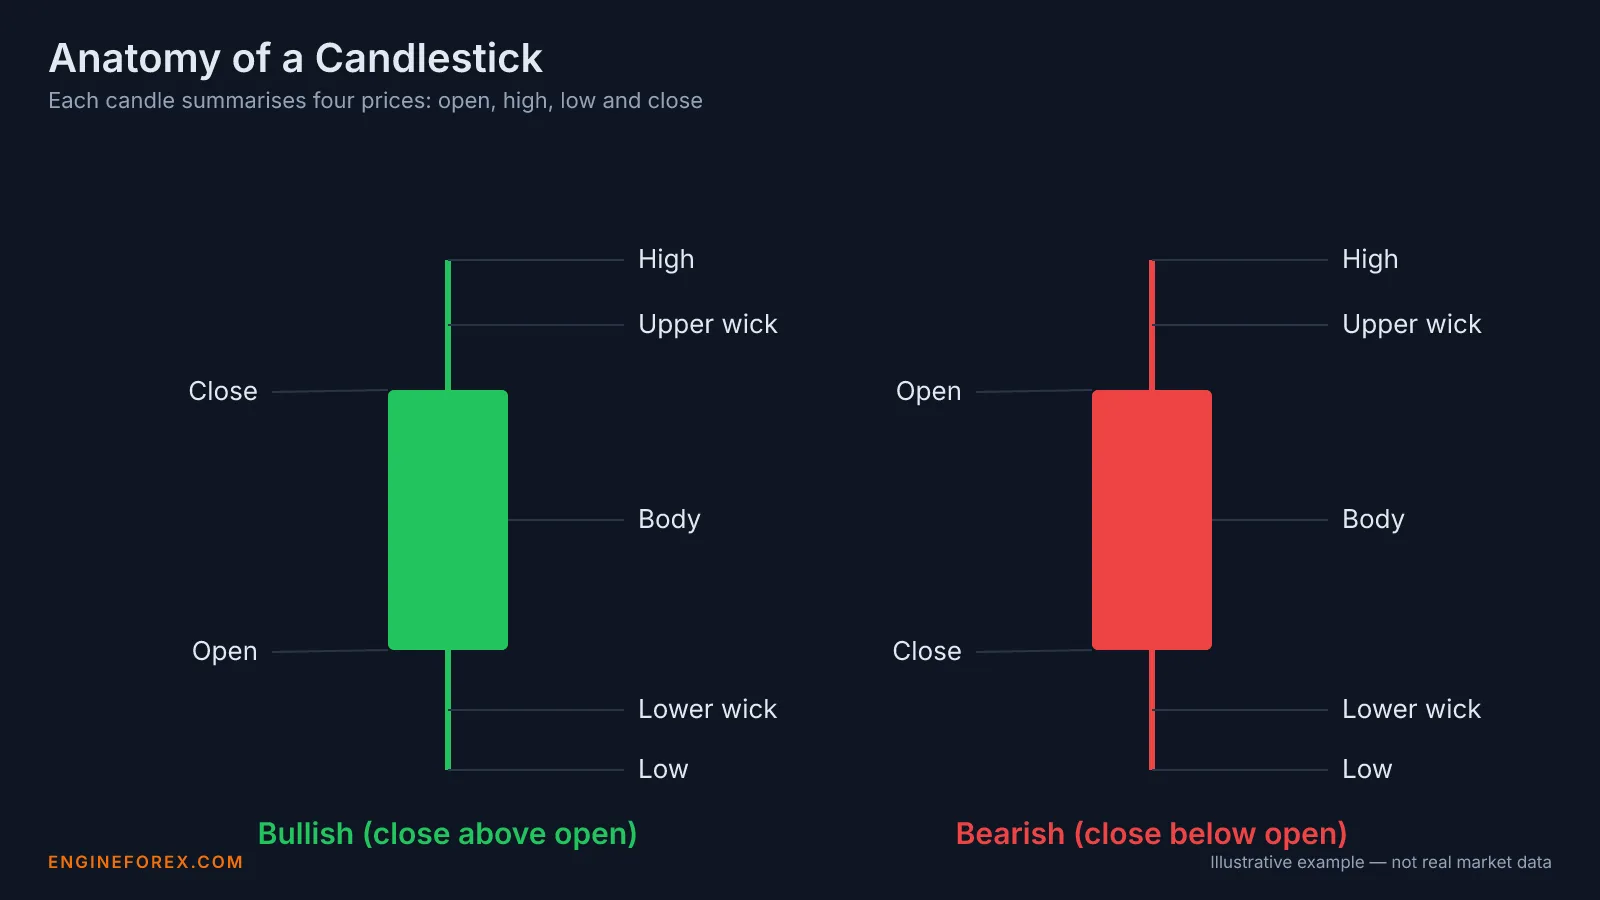
A candlestick chart shows four data points for a given time period: the open, high, low, and close. The thick body shows the range between opening and closing price.
The thin lines extending above and below (called wicks or shadows) show the highest and lowest prices reached. A green or white candle means price closed higher than it opened. Red or black means it closed lower.
Once you can read individual candlesticks, the next step is recognizing multi-candle patterns:
- Hammer: A single candle with a small body near the top and a long lower wick. It appears after a decline and suggests buyers stepped in to push price back up, signaling a potential reversal.
- Engulfing pattern: A two-candle pattern where the second candle's body completely engulfs the first. A bullish engulfing at a support zone suggests buying pressure is taking over. A bearish engulfing at resistance suggests the opposite.
- Doji: A candle where the open and close are nearly identical, producing a very thin body. It signals indecision and, when it appears after a strong trend, can warn of a reversal.
These patterns gain significance when they form at key support or resistance levels and are confirmed by volume or an indicator signal. On their own, they are clues, not commands.
What Are Support and Resistance Levels?
Support is a price level where buying interest tends to prevent further decline. Resistance is where selling interest tends to cap further advance.
Think of support as a floor and resistance as a ceiling. These are not exact lines but zones where the buyer-seller balance has shifted before. A support zone that has held three times carries more weight than one tested only once.
How Does Volume Confirm a Price Move?
Volume tells you how much conviction stands behind a price move. A breakout on high volume carries more weight than one on low volume.
One caveat for forex traders: spot forex is decentralized, so there is no consolidated volume feed. What you see on most forex platforms is tick volume (the number of price changes) or single-broker volume, which is a proxy rather than true market-wide data.
It can still be useful directionally, but it is not as reliable as the volume data available on a centralized equity exchange.
The Most Common Technical Analysis Indicators
How Do Moving Averages Work?
A moving average (MA) smooths short-term price fluctuations to reveal the underlying trend direction. Traders commonly compare a short-term MA with a long-term MA.
When a short-term MA crosses above a long-term MA, that is generally a bullish signal. The most widely cited version of this is the golden cross, which traditionally refers to the 50-day MA crossing above the 200-day MA. The reverse, a death cross, is considered bearish.
What Does the RSI Tell You?
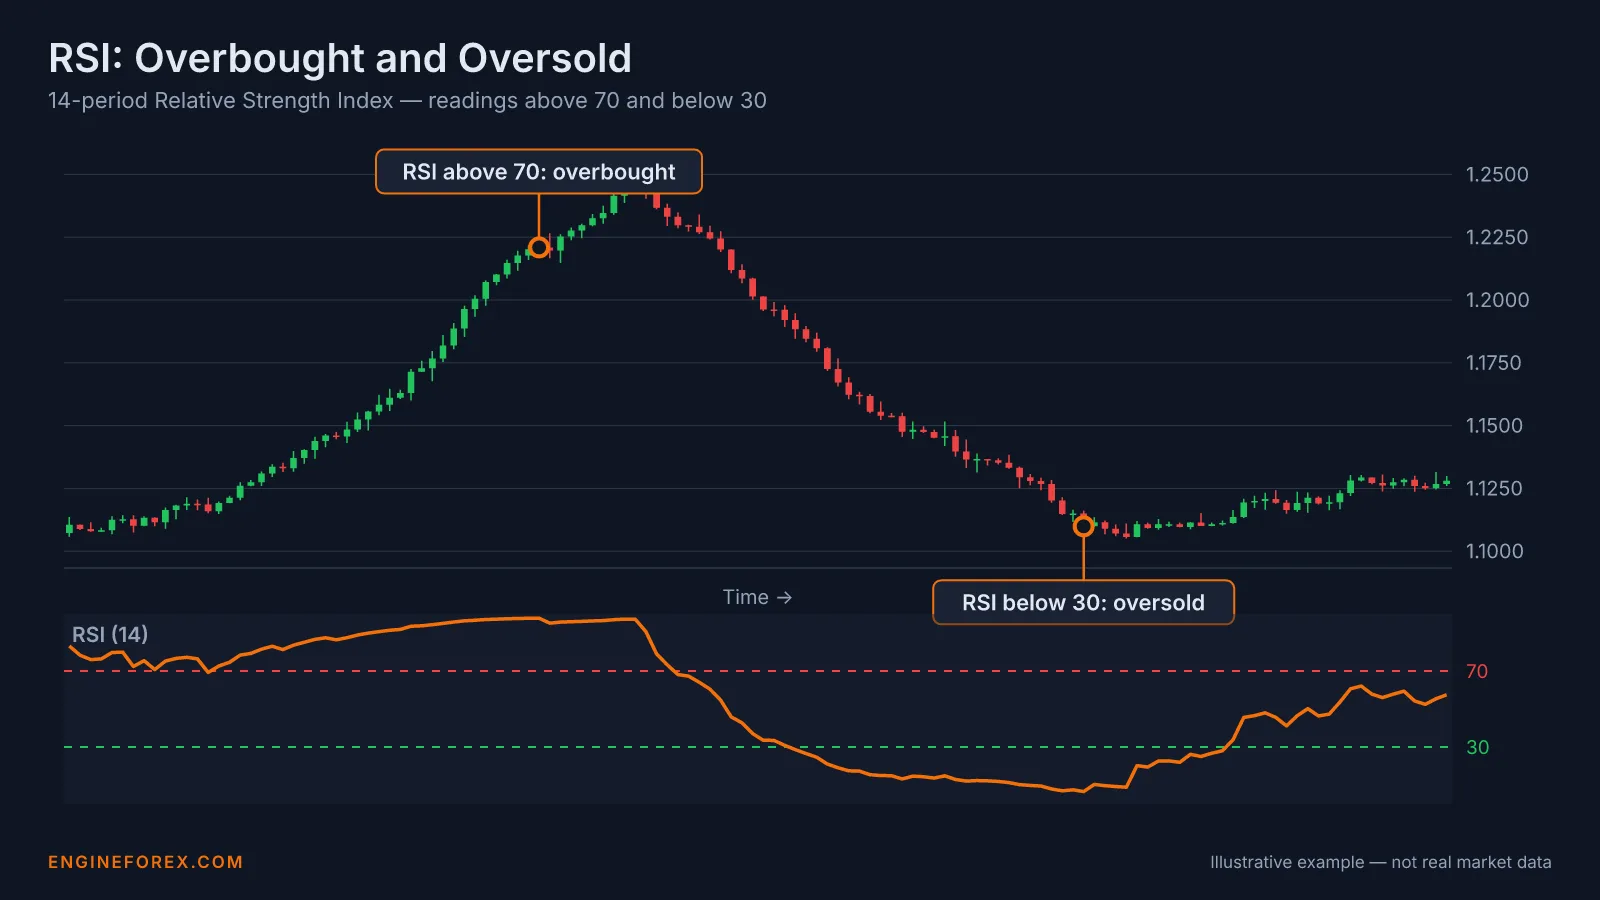
The Relative Strength Index (RSI) is a momentum oscillator that measures the speed and magnitude of recent price changes, moving on a scale from 0 to 100. An RSI above 70 suggests the asset may be overbought. Below 30 suggests it may be oversold.

The RSI does not tell you to buy or sell. It tells you how intense recent movement has been.
How Does the MACD Work?
The Moving Average Convergence/Divergence (MACD) is a trend-following momentum indicator composed of a fast line, a slow line, and a histogram. When the fast line crosses above the slow line, that is a bullish signal.
The histogram shows the gap between the two lines visually, making shifts in momentum easier to spot.
What Are Bollinger Bands?
Bollinger Bands are a volatility indicator that plots bands above and below a moving average. When bands widen, volatility is increasing. When they narrow (a "squeeze"), a breakout may follow.
A critical point: use two to three mutually confirming indicators of different types. Pair one trend indicator with one momentum indicator. Using three momentum indicators together just gives you the same information three times.
How Do You Read Indicators Together?
Suppose EUR/USD is trading at 1.0850. The 50-day moving average sits at 1.0780, and price is above it, suggesting an uptrend. The RSI reads 28, indicating recent selling pressure has pushed the pair into oversold territory within that broader uptrend.
Meanwhile, MACD's fast line has just crossed above its slow line, hinting that downside momentum is fading.
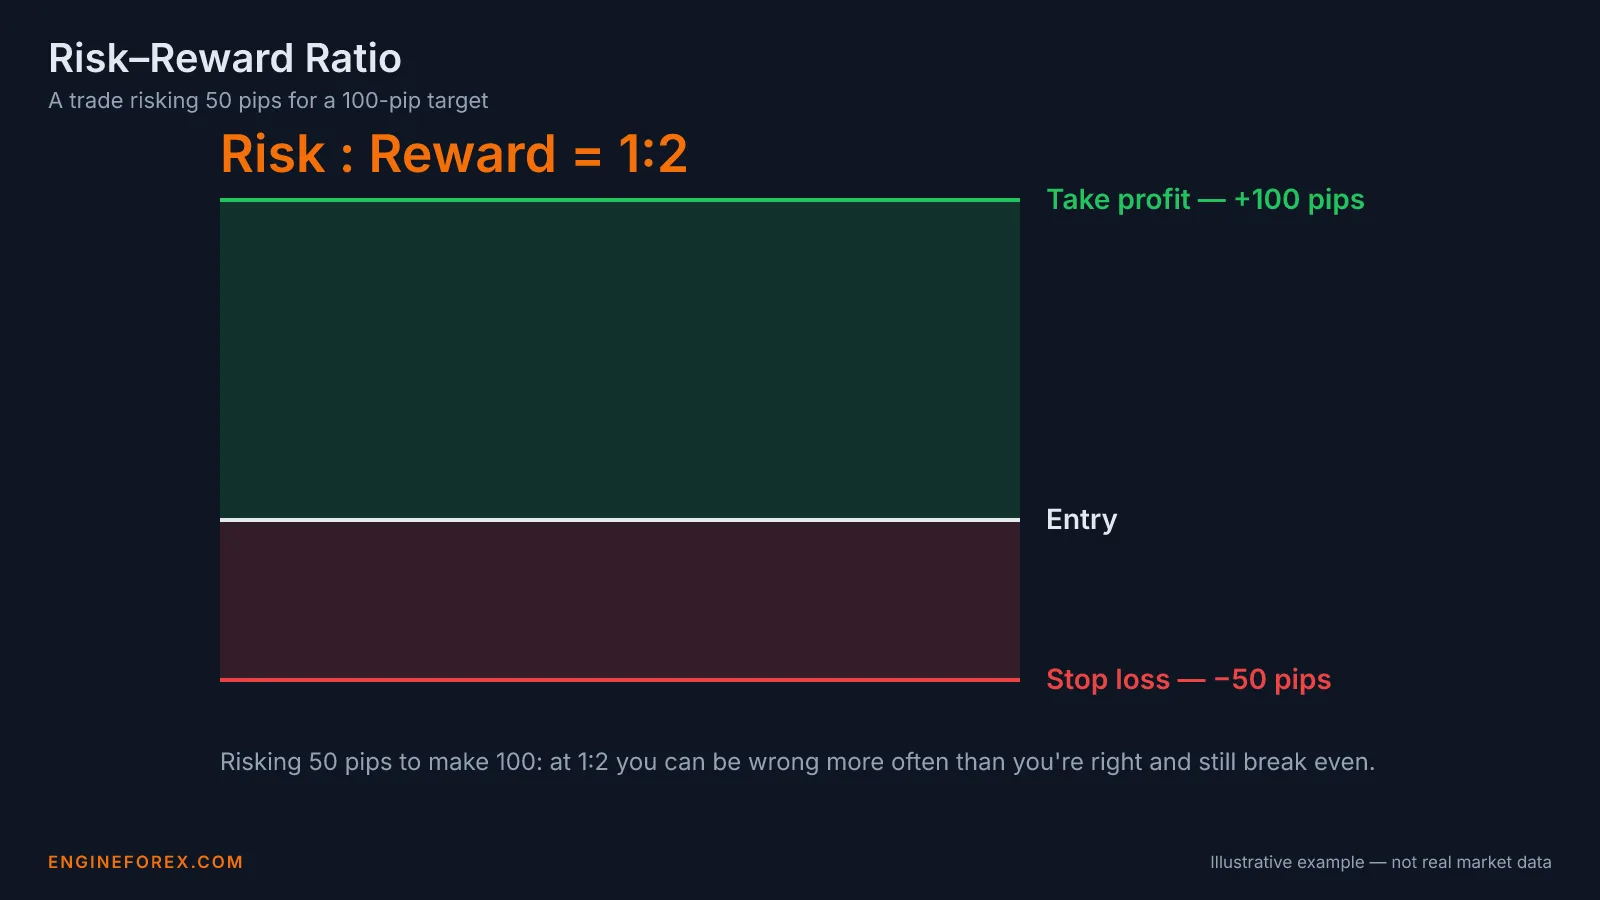
You could enter long at 1.0850, place a stop-loss just below the recent swing low at 1.0800 (risking 50 pips), and set a profit target at 1.0950, the next resistance zone (gaining 100 pips). That gives you a 1:2 risk-to-reward ratio.
The uptrend (MA), the oversold reading (RSI), and the bullish crossover (MACD) all confirm the same directional bias. No single indicator drove the decision; the confluence of all three did.
What Does a Practical Technical Analysis Strategy Look Like?
Layer 1: Higher-timeframe trend filter. Open daily and weekly charts and mark swing highs and swing lows. This tells you the overall direction.
Layer 2: Level layer. Move to 4-hour and 1-hour charts. Plot volume profile and VWAP (volume weighted average price). This identifies high-liquidity zones where price is likely to react.
Layer 3: Momentum trigger. Use RSI, MACD, or price action on lower timeframes as your entry signal. Only take trades that align with the higher-timeframe trend, from a high-liquidity level, after momentum confirmation.
One essential warning: statistics are not strategies. Any approach needs a defined entry, exit, risk-to-reward profile, position sizing rules, and context assessment.
How Should You Size Positions and Set Stop-Losses?
Position sizing: A common rule is to risk no more than 1-2% of your total account on any single trade. If your account holds $10,000 and you risk 1%, your maximum loss per trade is $100. You then calculate position size by dividing that dollar risk by the distance between your entry and your stop-loss.
Stop-loss placement: Place your stop beyond the nearest support or resistance zone so that normal price noise does not trigger it prematurely.

Quick-reference formula:
- Max dollar risk per trade = Account balance x Risk percentage (e.g., $10,000 x 1% = $100)
- Stop distance = Entry price minus stop-loss price (e.g., 1.0850 minus 1.0800 = 50 pips)
- Position size = Max dollar risk divided by stop distance (e.g., $100 divided by 50 pips = $2 per pip = 2 mini lots)
Before risking real capital, backtest your strategy over at least one full market cycle and across multiple instruments.
Does Technical Analysis Work for Forex Trading?
Yes. The core tools (moving averages, RSI, MACD, support and resistance, candlestick patterns) apply to any liquid market, including forex.
Forex traders accustomed to 24-hour sessions across London, New York, and Tokyo may find that certain timeframes produce cleaner signals during specific sessions, but the underlying principles do not change.
One important caveat: leverage caps and retail-trader protections differ dramatically by jurisdiction. ESMA rules cap retail forex leverage at 30:1 on major pairs across the EU, and ASIC applies the same 30:1 cap in Australia, while some offshore jurisdictions allow 500:1 or higher.
The same technical strategy can produce very different account outcomes under different leverage regimes. Always check your local regulatory framework before trading forex.
What Is the Best Way to Learn Technical Analysis?
Step 1: Learn to read candlestick charts. This is the foundation everything else builds on.
Step 2: Understand support and resistance before adding any indicators. These levels give context for every indicator signal you will ever see.
Step 3: Add one trend indicator and one momentum indicator. Resist the temptation to pile on more.
Step 4: Practice on a demo account. Do not risk real money while learning.
Step 5: Backtest across at least one full market cycle and multiple instruments before going live.
Having reviewed dozens of broker platforms, I would encourage beginners to pick a platform with strong charting tools and a robust demo environment. The best way to learn technical analysis is through deliberate, layered practice, not information overload.
Common Mistakes Beginners Make
Relying on a single indicator. Trusting one tool in isolation produces low-quality signals. Pair indicators of different types for confirmation.
Treating patterns as certainties. Technical analysis is probabilistic. A head-and-shoulders pattern does not guarantee a reversal. It suggests one is more likely.
Skipping backtesting. Jumping straight to live trading without testing against historical data is one of the fastest ways to lose money.
Trading against the higher-timeframe trend. If the daily chart shows a clear downtrend, a bullish signal on a 15-minute chart is fighting the current. You can win that fight occasionally. You will lose it more often.
Confusing statistics with strategies. A pattern's historical success rate means nothing without a defined entry, exit, risk-to-reward ratio, and position sizing plan.
Frequently Asked Questions
Was this article helpful?