What Is TradingView and How to Use It: A Complete Guide for Forex Traders
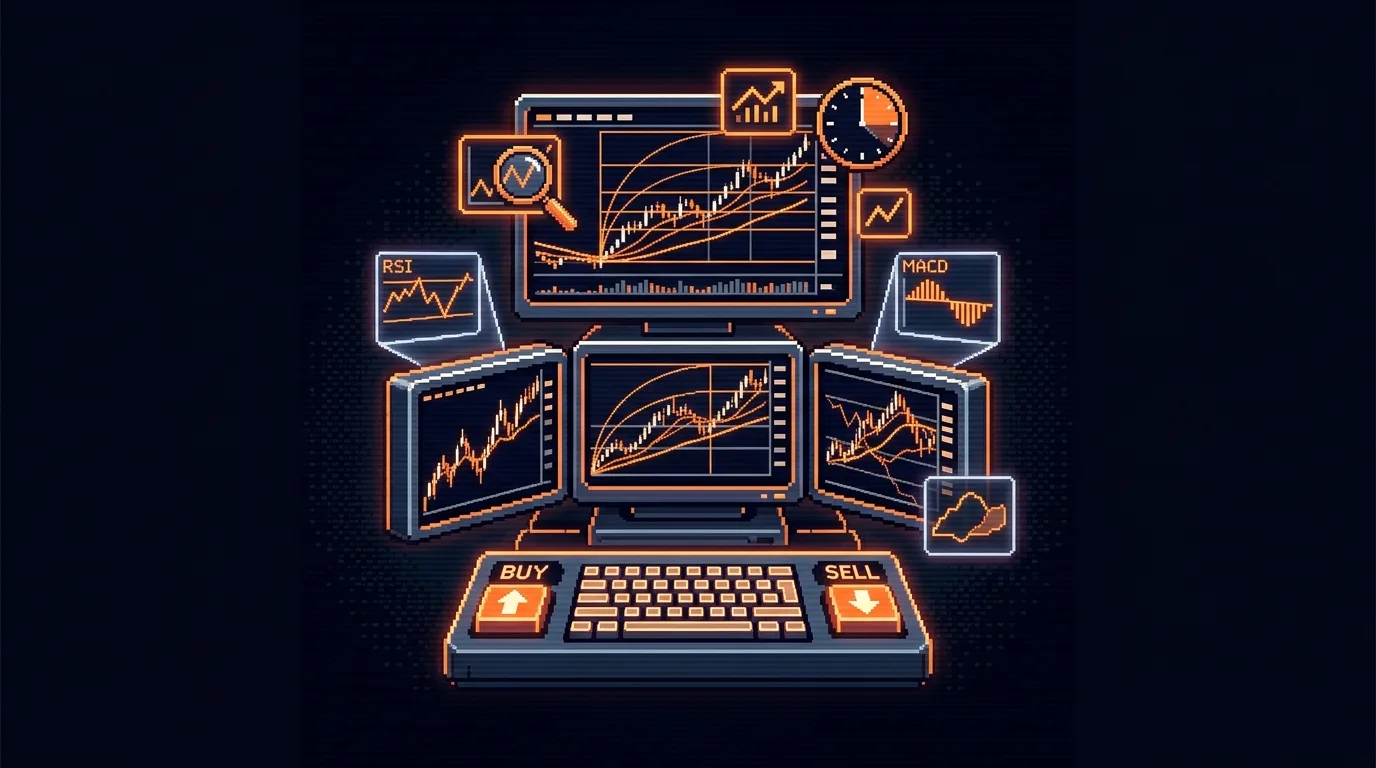
In short: TradingView is a charting and market analysis platform, not a broker. You use it to study price charts, layer on technical indicators, set alerts, and share trading ideas with a global community.
To trade real money you must connect a separate, regulated broker account, though built-in paper trading lets beginners practice risk-free first.
You have probably seen TradingView mentioned in every forex forum, YouTube tutorial, and trading subreddit you have visited. The name comes up constantly. If you are wondering what is TradingView and how to use it, this guide walks you through everything, from opening your first chart to placing a live trade through a connected broker.
TradingView does not hold your money or execute trades on its own. You connect a separate, regulated broker account for that. This guide explains what TradingView does, how forex traders use it, and how to get started even if you have never opened a chart before.
What Is TradingView Used For?
TradingView is to trading what Google Maps is to driving. It shows you where things are and helps you plan a route, but it does not drive the car. A charting platform displays price movements as visual charts so you can analyze markets before making decisions.
Understanding what is TradingView and how to use it starts with recognizing this core purpose: analysis first, execution through a broker second.
Founded in 2011 as a browser-based alternative to clunky desktop charting software, TradingView has grown into what technology publication GISUser describes as "the default charting tool for a large share of retail traders."
The platform covers forex (the global market for buying and selling currencies), stocks, ETFs, cryptocurrencies, commodities, futures, bonds, and major indices. That breadth matters because currency movements rarely happen in isolation.
Being able to glance at the US Dollar Index, gold, and Treasury yields alongside your EUR/USD chart gives you context that a forex-only platform cannot.
One thing to keep in mind: while forex data on TradingView is generally real-time and free, stock and futures data may be delayed by 15 minutes or more on the free tier unless you purchase exchange-specific data subscriptions.
Core tools include interactive charts, more than 400 built-in studies and strategies (indicators, overlays, and automated strategy templates), drawing tools, screeners that sort instruments by criteria you set, price alerts, and watchlists.
TradingView also functions as a social network for traders. You can publish chart analysis, follow other traders' ideas, and access community-built scripts. The platform runs in web browsers, as a desktop application, and on a mobile app.
| Feature | Details |
|---|---|
| Founded | 2011 |
| Asset classes covered | Forex, stocks, ETFs, crypto, commodities, futures, bonds, indices |
| Built-in indicators | More than 400 studies and strategies |
| Connected brokers | Over 100 regulated brokers worldwide |
| Platforms | Web browser, desktop app, mobile app (iOS and Android) |
| Paper trading | Built-in, uses virtual funds |
| Custom scripting | Pine Script programming language |
| Free-tier indicator limit | Two to three indicators per chart |
Can You Trade Real Money on TradingView? Understanding Brokers vs. Charting Platforms
This is the single most common point of confusion for beginners. Here is the clear answer: TradingView does not handle real money on its own. You need a connected broker for that. If you have been asking "is TradingView real money," the answer is no, not by itself.
Why Is TradingView Not a Broker?
A broker is a regulated company that executes your trades and holds your funds. TradingView does neither. As FxPro Academy states, "TradingView is not a broker... It is purely a charting and analysis platform that connects with brokers and data providers to display live market prices."
This distinction matters for your money. You will not find deposit buttons or withdrawal options on TradingView itself. Your capital stays with your broker at all times, under that broker's regulatory oversight.
How Does Real-Money Trading Work Through TradingView?
You link a separate, regulated broker account to TradingView. Once connected, you can place buy and sell orders directly from TradingView's charts. Those orders route to your broker for execution. TradingView is the cockpit; the broker is the engine.
TradingView connects to over 100 regulated brokers worldwide. Keep in mind that not all of these brokers are available in every country.
Traders in the United States, for instance, have a much shorter list of compatible brokers due to stricter regulatory requirements. Always check the Trading Panel for brokers available in your region.
OANDA's integration, for example, lets you trade across more than 1,700 instruments from TradingView charts. The prop trading firm FTMO added TradingView as a platform option in August 2026, expanding access further.
What Is Paper Trading on TradingView?
Paper trading is simulated trading with virtual funds. TradingView includes a built-in paper trading feature that lets you practice placing orders and testing strategies without putting real capital at risk.
If you are new to forex, this is where you should start. You can learn how the interface works, test whether your analysis holds up over time, and build confidence before connecting a funded broker account.
One honest caveat: paper trading results do not guarantee real-money performance. Markets feel different when actual capital is on the line, and slippage (the difference between your expected price and your actual fill price) does not affect virtual trades the way it affects real ones. Treat paper trading as a learning tool rather than a reliable predictor.
How to Use TradingView for Forex Trading: A Beginner's Tutorial
Here is a practical walkthrough for anyone learning how to trade on TradingView for beginners. Each step builds on the last, serving as a straightforward tradingview tutorial for forex traders.
How Do You Open Your First Forex Chart?

Go to TradingView in your web browser or open the app. In the search bar at the top, type a currency pair. A currency pair is two currencies quoted against each other, such as EUR/USD (the euro against the US dollar). Select it from the dropdown.
A chart appears. By default, it may show a simple line chart. Switch to candlestick view for more detail. Each candlestick shows the open, high, low, and close price for a given time period, packed into one visual shape.
Choose your timeframe from the toolbar: the 1-hour chart for intraday context, the 4-hour chart for swing trading setups, or the daily chart for the bigger picture.
How Do You Apply Indicators and Draw Levels?
Click the "Indicators" button on the top toolbar. You can search from more than 400 built-in options. Note that TradingView's free tier limits you to two or three indicators per chart, so you may need to swap indicators rather than stacking them. Paid plans raise this limit significantly.
Three solid starting points for anyone exploring how to use TradingView for forex trading:
- Moving average: smooths out price data to show the average price over a set number of periods. Useful for identifying whether a pair is trending up or down.
- RSI (Relative Strength Index): a momentum indicator that measures whether a currency pair may be overbought (potentially due for a pullback) or oversold (potentially due for a bounce). Values above 70 suggest overbought conditions; below 30, oversold.
- MACD (Moving Average Convergence Divergence): shows the relationship between two moving averages. Traders watch for crossovers as potential buy or sell signals.
| Indicator | What it measures | Beginner use case |
|---|---|---|
| Moving Average | Average price over a set number of periods | Identify trend direction on a currency pair |
| RSI | Momentum (overbought vs. oversold) | Spot potential reversal zones; above 70 = overbought, below 30 = oversold |
| MACD | Relationship between two moving averages | Watch for crossovers as potential buy or sell signals |
For drawing on the chart, use the tools on the left sidebar. Horizontal lines mark support and resistance, which are price levels where buying or selling pressure has historically concentrated. Trend lines connect a series of highs or lows to visualize price direction.
TradingView also offers Pine Script, its built-in programming language for creating custom indicators and strategies. You do not need it as a beginner, but knowing it exists means you will not outgrow the platform quickly.
How Do You Set Alerts and Build a Watchlist?
Right-click on any price level on your chart and select "Add Alert." TradingView notifies you by app notification, email, or browser popup when price reaches that level. You can also set alerts based on indicator values, for example: "Alert me when RSI on GBP/USD crosses above 70."
This matters because you cannot watch charts all day. Alerts let the platform do the watching for you.
To build a watchlist, click the watchlist panel on the right side. Add the currency pairs you want to monitor. Consider including the US Dollar Index and gold to track broader market context alongside your forex pairs.
How Do You Connect a Broker and Place a Trade?
At the bottom of the chart, find the "Trading Panel." Click it and select your broker from the list. You will log in to your broker account directly within TradingView. Once linked, you can place market orders (executed immediately at the current price), limit orders (executed only when price reaches a level you specify), and stop orders.

One feature worth highlighting: you can drag stop-loss and take-profit levels directly on the chart after placing a trade. This visual approach to risk management is more intuitive than typing numbers into order boxes and reduces the chance of a costly input error.
How to Trade on TradingView Mobile App
TradingView's mobile app is available for iOS and Android. It mirrors the core features of the web and desktop platforms: charting, indicators, drawing tools, watchlists, alerts, and broker-connected trading.
The mobile app works best for monitoring positions and acting on alerts when you are away from your desk. Most traders prefer a larger desktop screen for detailed technical analysis, then use the mobile app for quick decisions during the day.
If you are learning how to trade on the TradingView mobile app, the workflow is nearly identical to the web version. The main adjustment is screen size. You will scroll more to access tools, and drawing precise trend lines with your thumb takes practice.
Can You Trade on TradingView Without a Broker?
No. You cannot trade on TradingView without a broker account if you want to use real money.
The only trade-like activity available without a broker is paper trading. Paper trading uses virtual funds and does not generate real profits or losses. It is strictly a practice tool.
For real-money forex trading, you need to open an account with a regulated broker and connect it to TradingView. As Babeepips explains, "TradingView exists purely as a charting and idea-sharing layer. Actual trade execution always runs through a separate, regulated broker account."
This separation actually works in your favor. Your funds sit with a regulated entity subject to financial oversight, not with a charting website. If TradingView went down for maintenance tomorrow, your money would still be safe at your broker.
TradingView vs. MetaTrader and Other Platforms
If you are comparing options, here is how TradingView stacks up against MetaTrader, the most common forex-specific platform:
| Feature | TradingView | MetaTrader (MT4/MT5) |
|---|---|---|
| Primary role | Charting and analysis platform | Trading platform with built-in charting |
| Broker dependency | Requires connected broker for execution | Typically provided directly by brokers |
| Social/community features | Yes (idea sharing, community scripts) | Limited |
| Multi-asset coverage | Forex, stocks, crypto, commodities, futures, bonds, indices | Primarily forex and CFDs |
| Built-in indicators | More than 400 studies and strategies | Fewer built-in; extensible via MQL programming |
TradingView's strength is cross-asset visualization and community. As VCG Markets notes, "TradingView wins on cross-asset overlay and comparison charting." MetaTrader's strength is deep, direct integration with forex brokers and faster order routing for some execution models.
Other platforms in this space include Finviz, TrendSpider, Thinkorswim, StockCharts.com, and Investing.com. Your choice depends on whether you prioritize charting depth, social features, broker integration, or a specific asset class.
For most forex beginners, TradingView is a strong starting point for analysis, paired with whichever regulated broker suits your region and trading style.
Frequently Asked Questions
Was this article helpful?